散点图
GeoJSONLayer是用来渲染点、线、面矢量数据的,我们先从点开始!气象中点数据的可视化最常见的应用就是站点填值。
在不同的底层显示引擎下的类名有所区别,Leaflet中为LGeoJSONLayer,Cesium中为CGeoJSONLayer,三维的用法基本兼容二维,但是部分属性在三维中不完全支持,但是三维有独有的挤压效果。
本文中我们先以二维为例进行介绍,这部分基本可以直接在三维中也这样使用,三维的也可以单独参考三维矢量图层。
绘制点
我们按照图层=数据+样式的思路,先将点数据绘制到地图上。
创建数据解析器
我们获取到站点数据后,使用矢量数据解析器解析我们的站点数据。这里以cimiss数据为例。
const json = await getJSON("public/demos/data/autostation011.json");
const provider = new CimissStationFeatureProvider(json);
创建样式
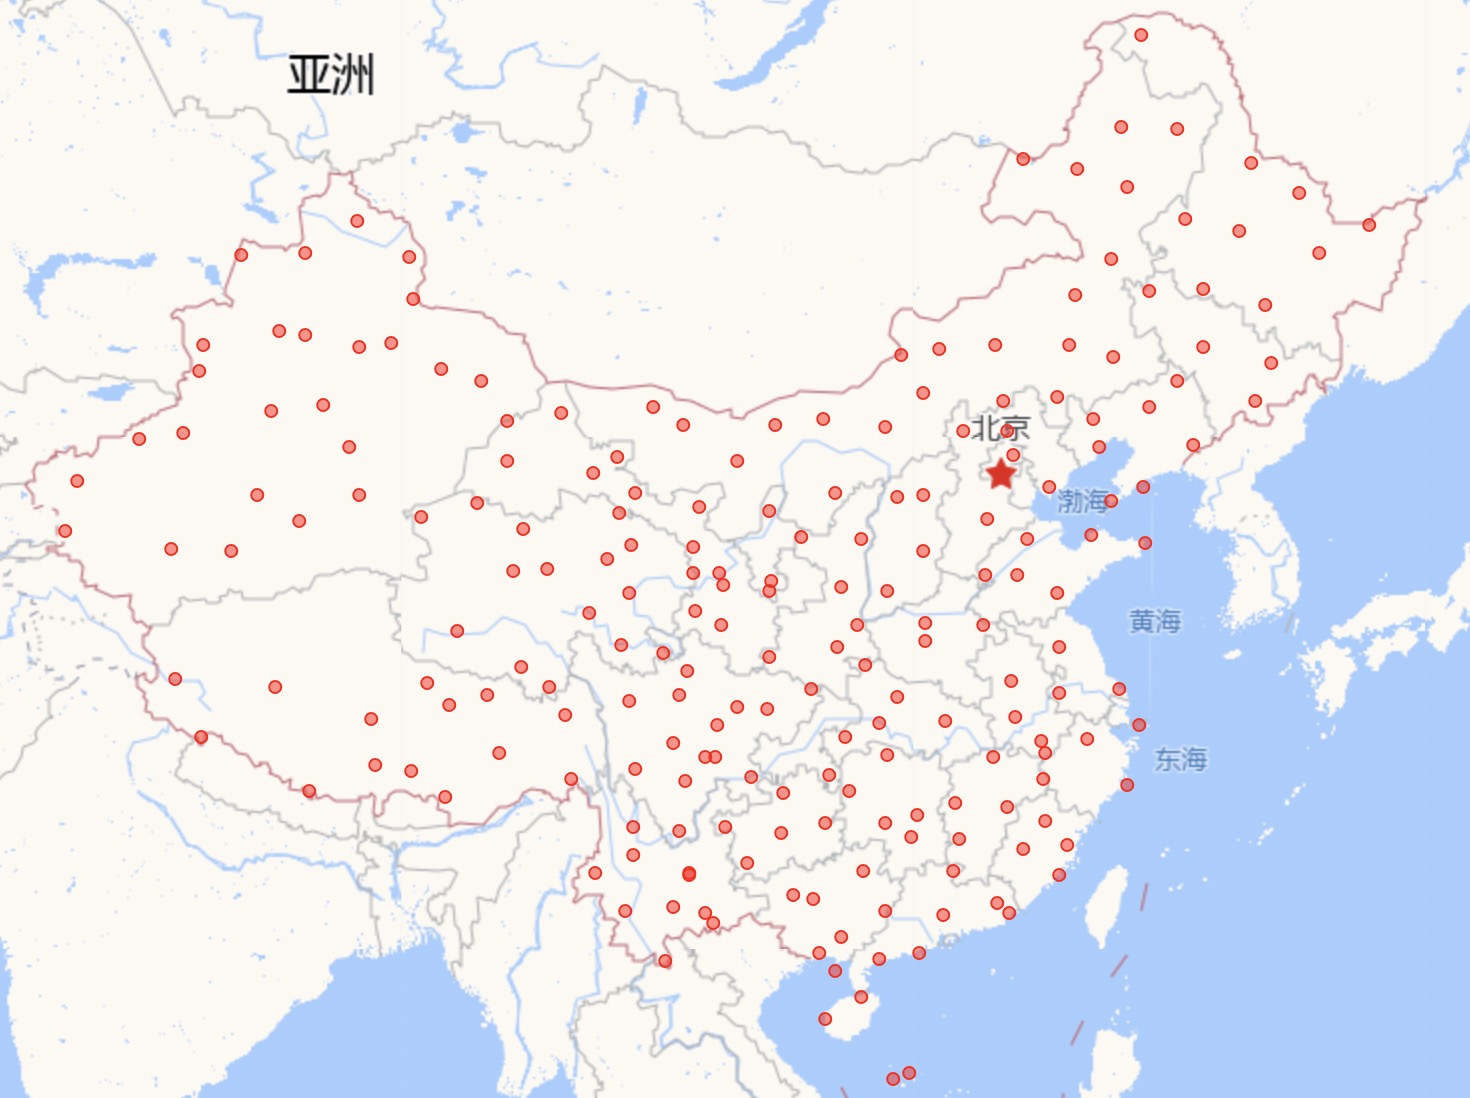
这里我们设置了一个点的样式,颜色透明为0.5的红色,大小为3px,描边颜色为红色
const style = {
   point:{
       color:"rgba(255,0,0,0.5)",
       size:3,
       strokeColor:"red"
   }
}
创建图层
有了数据源和样式,我们就可以创建图层了,并把图层加载到地图上。
const layer = new LGeoJSONLayer().setDataSource(provider).setDrawOptions(style);
layer.addTo(map);
我们来看下到目前为止的显示效果
动态配置样式
在样式配置中,除了像上面示例中配置固定值外,我们还支持使用函数或者分级规则来配置样式,从而增加灵活性。
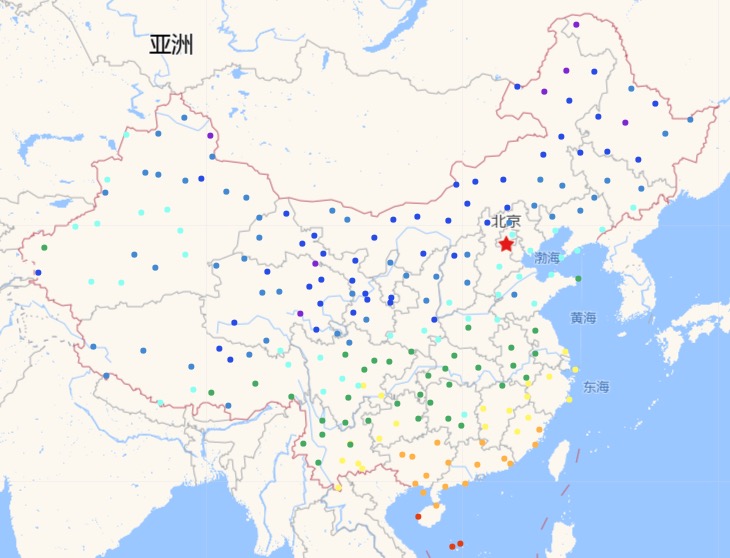
这里我们用color属性举例,比如根据温度色例来填充点的颜色。
使用分级规则配置
const style = {
   point:{
       color: {
           "stops": [   //分段规则数组
                {
                  "stop": "rgb(37, 0, 45)",
                  "value": -60
                },
                {
                  "stop": "rgb(119, 32, 117)",
                  "value": -40
                },
                {
                  "stop": "rgb(176, 33, 198)",
                  "value": -32
                },
                {
                  "stop": "rgb(137, 43, 215)",
                  "value": -24
                },
                {
                  "stop": "rgb(43, 85, 234)",
                  "value": -16
                },
                {
                  "stop": "rgb(75, 148, 215)",
                  "value": -8
                },
                {
                  "stop": "rgb(149, 255, 243)",
                  "value": 0
                },
                {
                  "stop": "rgb(77, 179, 109)",
                  "value": 8
                },
                {
                  "stop": "rgb(255, 247, 113)",
                  "value": 16
                },
                {
                  "stop": "rgb(255, 186, 78)",
                  "value": 24
                },
                {
                  "stop": "rgb(230, 71, 18)",
                  "value": 32
                },
                {
                  "stop": "rgb(96, 17, 17)",
                  "value": 40
                },
                {
                  "stop": "rgb(53, 0, 0)",
                  "value": 60
                }
          ],
          "fieldName": "TEM"   //用于分段的属性字段名,必选项
       },
       size:3
   }
}
关于分段规则的可配参数说明,查看IStopRulesOptions
再看下分段显示后效果
如果资源管理器中已经加载了该分段规则,我们还可以使用loader来配置,显示效果和上面是一样的。
const style = {
   point:{
       color:"color-temp#res?field=TEM",
       size:3
   }
}
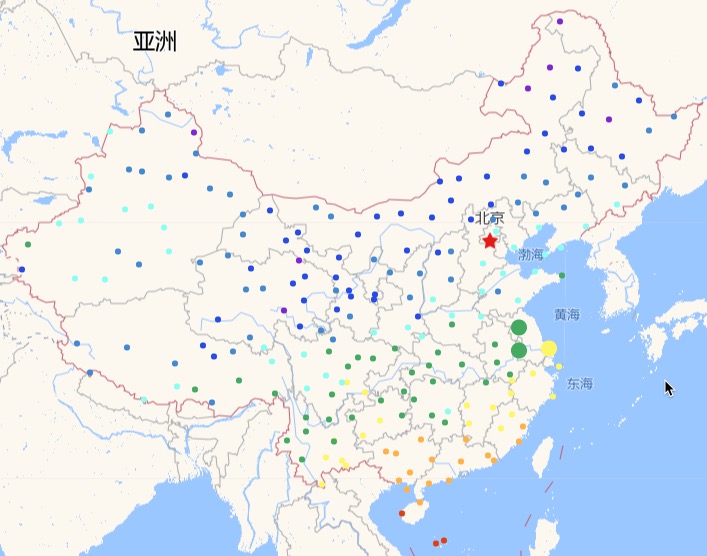
使用函数配置
我们使用函数来让江苏省内的站点显示得更大些
const style = {
   point:{
       color:"color-temp#res?field=TEM",
       size:(feature) => {
         if (feature.properties["Province"] === "江苏省") {
           return 8;
         } else {
           return 3;
         }
       },
   }
}
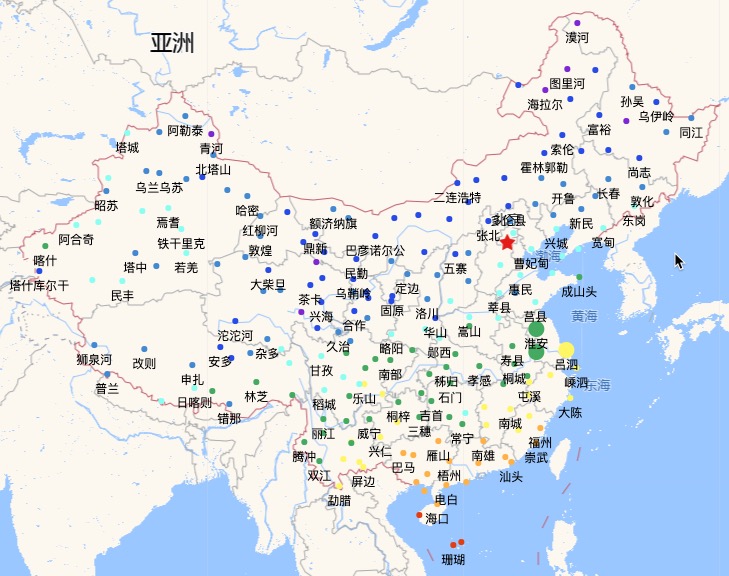
绘制点标签
当我们想在点的周围展示一些信息的时候,可以通过添加标签的方式增加,标签分为文本标签和图片标签两种。
文本标签
比如我们想显示站点名称,并且自动抽稀。
const style = {
   point:{
       color:"color-temp#res?field=TEM",
       size:(feature) => {
         if (feature.properties["Province"] === "江苏省") {
           return 8;
         } else {
           return 3;
         }
       },
       label:[
         {text: {
             data: "$Station_Name", //文本标签内容:取属性字段Station_Name即站名
             offset: [0, 15],       //文字离中心点的偏移量
             avoidCollison: true,   //是否碰撞检测,即自动抽稀。避免地图在缩小时,很多标签文本堆叠在一起,不美观。
         }}
       ]
   }
}
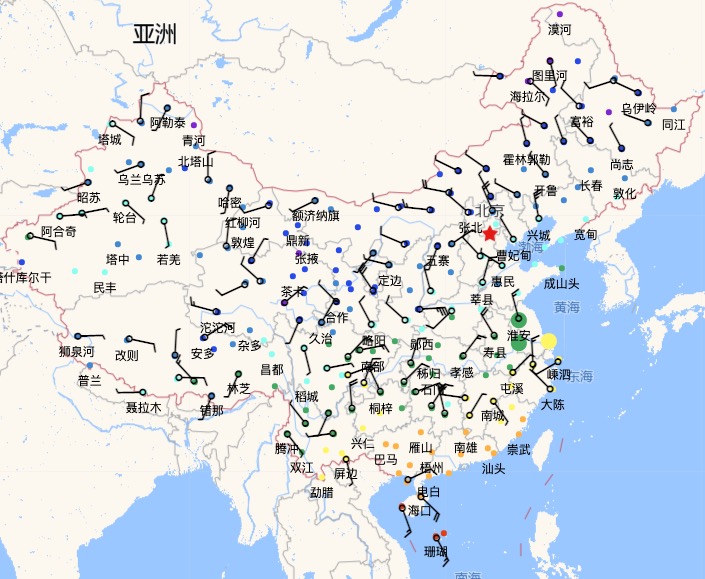
在上面的基础上,我们再加上字体风杆
const style = {
   point:{
       color:"color-temp#res?field=TEM",
       size:(feature) => {
         if (feature.properties["Province"] === "江苏省") {
           return 8;
         } else {
           return 3;
         }
       },
       label:[
         {text: {
             data: "$Station_Name", //文本标签内容:取属性字段Station_Name即站名
             offset: [0, 15],       //文字离中心点的偏移量
             avoidCollison: true,   //是否碰撞检测,即自动抽稀。避免地图在缩小时,很多标签文本堆叠在一起,不美观。
         }},
         {
            text: {
                data: "$WIN_S_INST#wind",       //文字内容:取数据源中的属性字段WIN_S_INST,并使用wind这个loader将风速值转换为风杆字体编码
                font: "bold 45px wind",         //字体:使用风杆字体
                avoidCollison: true,            //进行碰撞检测,即会自动抽稀
                angle: "$WIN_D_INST#degree2arc" //文字旋转角度:取数据源中的属性字段WIN_D_INST,并使用degree2arc这个loader将角度值转换为弧度
            }
        },
       ]
   }
}
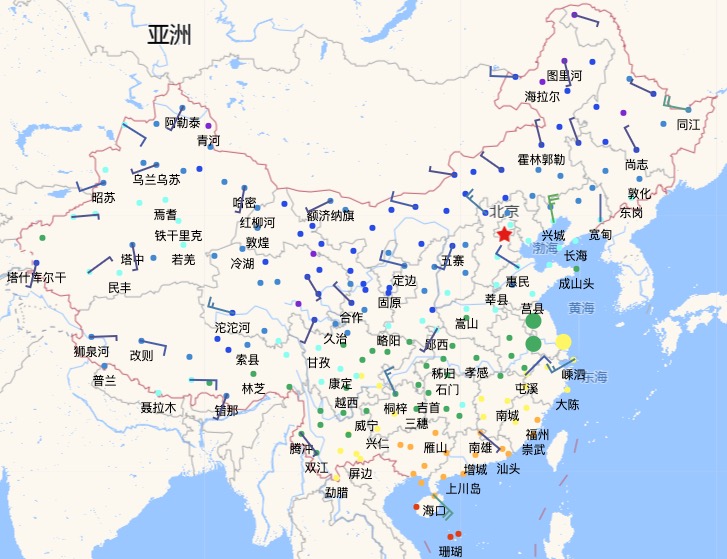
图片标签
或者我们也可以使用图片的方式为每个站点加上风杆,并且使用风的色例来填充风杆颜色。

const style = {
   point:{
       color:"color-temp#res?field=TEM",
       size:(feature) => {
         if (feature.properties["Province"] === "江苏省") {
           return 8;
         } else {
           return 3;
         }
       },
       label:[
         {
           text: {
             data: "$Station_Name", //文本标签内容:取属性字段Station_Name即站名
             offset: [0, 15],       //文字离中心点的偏移量
             avoidCollison: true,   //是否碰撞检测,即自动抽稀。避免地图在缩小时,很多标签文本堆叠在一起,不美观。
           }
         },
         {
           image: {
                data: "image-wind#res?field=WIN_S_INST",  //图片内容为资源ID为image-wind的分段规则,stops中的fieldName覆盖为WIN_S_INST
                angle: "$WIN_D_INST#degree2arc",          //图片旋转角度:WIN_D_INST这个属性值,并弧度转角度
                color: "color-wind#res?field=WIN_S_INST", //图片颜色:取资源ID为color-wind的分段规则,分段取值的字段为WIN_S_INST
                offset: [-12, -28],                       //图片位置偏移
                avoidCollison: true,                      //进行碰撞检测,即会自动抽稀
           }
         },
       ]
   }
}
标签的样式有很多的可配置项,我们再将每个站点的温度数据加入地图。
const style = {
   point:{
       ...
       label:[
         ...
         {
           text: {
             data: (feature) => {return feature.properties.TEM + " °c"},
             avoidCollison: true,
             offset: [0, -18],
             backHeight: 15,                         //背景色的高度
             backRoundRect: true,                    //文字背景色是否使用圆角矩形,默认为false。此配置优先级高于backCircle
             backRoundRadius: 4,                     //文字背景色的圆角像素数,默认为6px
             backColor: "color-temp#res?field=TEM",  //文字背景色
             backStrokeColor: "rgb(255,255,255)",    //背景色描边颜色
             color: "rgb(255,255,255)",              //文字颜色
             strokeColor: "gray",                    //文字描边颜色
           }
         },
       ]
   }
}
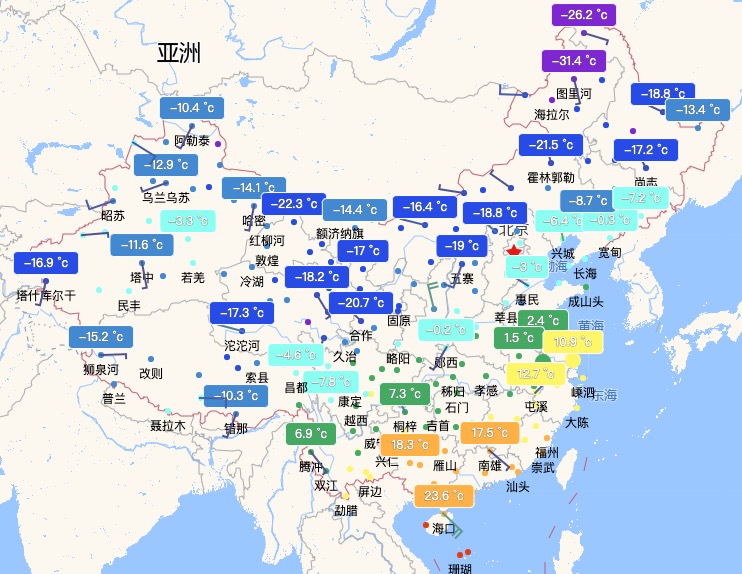
碰撞检测
在上面几个示例中,我们多次使用了avoidCollison来进行碰撞检测,即自动抽稀,点和标签都是支持该属性的。
但我们发现上图中有些背景色叠加在一起了,这时我们可以使用collisionExtendSize来微调有背景色时的碰撞检测的扩展宽高。
const style = {
   point:{
       ...
       label:[
         ...
         {
           text: {
             data: (feature) => {return feature.properties.TEM + " °c"},
             avoidCollison: true,
             collisionExtendSize: [10, 10],          //碰撞检测的扩展宽高,用于有背景色时的微调,默认[0,0]
             ...
           }
         },
       ]
   }
}
如何设置某些点不参加碰撞检测,即一直显示?
只要把avoidCollison参数的数值由true改为函数,然后判断到当前feature是希望一直展示的内容时返回false,否则返回true即可。掩膜边界
如果我们只需要展示某一部分区域的数据,可以设置LGeoJSONLayer图层的构建参数mask,mask可以是一个GeoJSON的多边形对象集合,也可以是保存这个集合的资源ID。
创建图层时设置mask
在创建图层都时候设置mask
getJSON("public/demos/data/china.poly.json").then(json => {
    const layer = new LGeoJSONLayer({
        name: "自动站",                            //图层名称
        pane: consts.customPanes.station.name,    //与Leaflet中的pane一致,用来控制图层的zIdx
        mask: json                                //设置掩膜边界
    }).setDataSource(dataSource)...
    layer.addTo(map);
})
创建后重设mask
或者创建图层后单独设置图层的mask,使用setLayerOptions方法,重新设置图层构造参数,会触发重绘
//设置掩膜边界,这里mask是保存这个集合的资源ID
layer.setLayerOptions({ mask: "mask-china-feature" }, true);
数据监听
通过LGeoJSONLayer的构建参数trackDataSource设置为true,可以监听矢量数据源的更新消息,矢量数据源发生更新后会自动触发重绘。
const layer = new LGeoJSONLayer({
    name: "自动站",
    trackDataSource: true, //是否监听数据源的更新消息
})
矢量数据源更新是指,矢量类数据解析器通过updateFeatures方法更新数据内容
setTimeout(() => {
  getJSON("public/demos/data/autostation011.json").then(json => {
    dataSource.updateFeatures(json); //获取新数据,并更新dataSource
  });
}, 5000);
鼠标拾取
LGeoJSONLayer是支持鼠标拾取其中矢量元素的。因为图层默认是不进行拾取的,我们需要设置图层的构建参数pickType,并给图层绑定拾取后的回调函数。
const layer = new LGeoJSONLayer({
    pickType: "point",                                        //拾取类型:点拾取
    name: "自动站",                                            //图层名称
    pane: consts.customPanes.station.name                     //与Leaflet中的pane一致,用来控制图层的zIdx
})
...
let popUp = L.popup({}, layer);                               //Leaflet中创建一个popup
layer.on(LGeoJSONLayer.EventTypes.picked, args => {           //绑定点拾取事件
    let content = "";
    const feature: GeoJSON.Feature<GeoJSON.Point> = args['data'][0];
    for (const key in feature.properties) {
        content += `${key}:${feature.properties[key]}<br/>`
    }
    popUp.setContent(content);
    popUp.setLatLng(L.latLng(feature.geometry.coordinates[1], 			feature.geometry.coordinates[0]));
    popUp.openOn(map);
});
无评论